Posted on May, 10, 2022 at 09:49 am
Charting the long-term trends in European wheat and maize yields and harvested areas and the relation of yields to climatic and economic drivers, two profound spatial processes become apparent. One consequence of the relatively late modernization of Eastern Europe has been to shift the focus of grain production from West to East. The warming trend prevailing over the past decades in the summer and winter seasons has been accompanied by a South to North shift in the harvested areas. The combination of these two processes has meant that the north-eastern sector of the European grain chessboard has emerged as the main beneficiary. There, the relatively low sensitivity of cereals to climatic change plus high economic growth rates have been accompanied by the most dynamic increases in cereal yields on the continent. As a result, a modern version of the 3000 year-old grain distribution system of the Ancient World is being restored before our eyes. One noteworthy finding is that increasing January–March temperatures have had a significant positive impact on wheat yields from Northern to South-Eastern Europe, and this is, at least in part, compensating for the negative impact of summer warming.
Wheat (Triticum aestivum) provides almost 20% of humanity’s energy intake1,2. Providing ca. one-third of the world’s annual wheat harvest, Europe is a centre of global wheat production, while if one considers wheat exports, European countries accounted for 53% of global wheat exports between 2013 and 20173. Maize (Zea mays L.) is the primary forage of livestock globally, and a staple food in certain tropical and sub-tropical areas4. As with wheat, Europe’s share of total global maize production (ca. 11%), is far exceeded by its share of global maize exports (30% between 2013 and 2017)3. What is more, in global terms, wheat and maize production has grown most dynamically in Eastern Europe in recent decades5,6,7. Meanwhile, the wheat production of other leading producers, e.g. Australia, China and a major part of India, and maize production in Northern China, Northern India and Central America has stagnated3,8. As a result, Eastern European countries have taken over the leading positions in global export rankings in recent years3.
Eastern Europe as a supplier of grain to other regions has a long story9. The fertile croplands of the Black Sea hinterland had been integrated into the Mediterranean Greek trading system by the early 2nd millennium BC. The steady, regular supply of grain from the Black Sea Basin was underway, and was to become by the latest in the fourth century BC10,11 a key resource maintaining the relatively high population density in the Eastern Mediterranean world. Subsequent developments notwithstanding, for example, hegemony over the majority of Black Sea region by, among others, the Roman, Byzantine, Ottoman and Russian empires, the grain of the Eastern European steppe was an integral part of Eastern Mediterranean food security until the communist takeover12,13. What is more, Baltic grain, from Poland, Lithuania and other Eastern entities was a key component in Scandinavian and Western European food security from the thirteenth century till the nineteenth century “overseas grain invasion”14,15. The biophysical basis of the high grain production potential in Eastern Europe is that some of the richest top soils in the world (Chernozems, Mollisols in the USDA taxonomy) cover vast areas in the region16. This outstanding natural soil fertility is not just important in and of itself, but plays a key role in climate resilience, mitigating extremities associated with the continental climate that characterizes Central and Eastern Europe17. However, even these relatively favorable natural conditions could not mitigate or compensate for the extreme effects of collectivization, the liquidation of earlier elites and the disengagement from the world economy prevalent under the communist regimes18. Due to technological disruption occasioned by this, the productivity of Eastern Europe could not evolve and acute food shortage moreover famines became commonplace in communist regimes19,20.
The dynamic growth in grain yields brought about by the Green Revolution of the mid-twentieth century had slowed down by the 1990s, reaching a plateau, or even turning to a decrease in key agricultural regions of the world21; this, in turn, has caused serious concerns about global food security22,23. The direct and indirect effects of climate change24,25, the diminution of freshwater resources26,27, the simplification of crop rotation and decreasing artificial fertilizer use28 are mentioned among the main drivers of this negative process. Droughts, diminishing freshwater supplies27,29,30,31, and soil degradation due to poor land management in industrialized agriculture17 are core problems over the greater part of Europe. For these reasons, tens of millions of hectares of fertile soils have suffered catastrophic erosion across Eastern Europe17. Therefore, adaptation to climate change, and specifically an enhanced ability to adapt to heatwaves, have now become top priorities for European agriculture25,32,33. Statistical and process-based model analyses suggest that a 1 °C rise in global mean temperature will lead to a 4.1 to 6.4% decrease in wheat yields if the sown area remains constant and there is no fundamental improvement in technology34,35. Furthermore, drylands such as those surrounding the Mediterranean Basin, or continental fields, can expect a greater degree of warming than humid lands36,37, and it is precisely in these drylands, rather than humid zones, where increasing temperature accounts for a significantly higher degree of interannual fluctuation in cereal yields29,38. Besides these negative effects, current environmental changes may have positive impacts on certain plant communities, including cultivated plants in several regions. Comparing plants utilizing different photosynthetic pathways, the general expectation is that C3 plants, representing ca. 90% of plant species, including wheat, have been beneficiaries of the elevated atmospheric CO2 concentration, while C4 plants, including maize, are relatively unresponsive to rising CO2 levels39,40. That said, there is a broad consensus that the expected impacts of climate change on grain production will be more positive in Northern Europe than other parts of the continent39,41. This includes increasing precipitation counterbalancing the negative impact of warming in the British Isles and the Atlantic coasts of Western Europe42. Beyond this, the lengthening of growing seasons due to warming generates a shift in crop cultivation observable along the northern border of the European croplands43. These regional differences in vulnerability also manifest themselves on the map of potential wheat and maize yields44. Taken together, the importance of Europe in global food security, and the rapid change in production structure necessitate the identification of yield trends and the main drivers behind changes in yields over longer periods on the continent33. Nevertheless, a detailed analysis of the overall pattern of trends in the wheat and maize yields and harvested areas of European countries over the past 25 years is still lacking.
The expected agricultural development including yield increase in cropland farming may come from the improving environmental conditions and the growth of the invested human and material resources45. The estimated share of human input in wheat and maize production ranged between 91–98 and 91–100%, respectively, in the EU countries in 200846. To assess the measure of agricultural inputs (utilized material resources) in a uniform way, the total factor productivity (TFP), the most popular measure of agricultural productivity, was invented47. The TFP index is defined as the ratio of output and inputs48. The calculation of inputs to the agricultural TFP is based on net capital stock intensity, the number of farm labourers, the extent of the land, the amount of or total metric horse-power of farm machinery, and the sum of fertilizers and livestock47,49. Within the framework of a science-based agriculture50 and the transformation of environmental conditions, however, the “residual” part of the outputs that cannot be accounted for the inputs48 may increase precipitously to an extreme degree, and the listed input factors cannot bring a profound understanding of agricultural productivity growth50,51.
Considering these points a preliminary examination of the available TFP indices was made49, and it was found that there are no consistent data on agricultural productivity for all European countries over the long term (Supplementary Table S8). Self and Grabowski (2007)52 suggest that the “improvements in agricultural technology have a significant impact on long-run economic growth”. Moreover, a strong dependence of agriculture development on the macroeconomic environment53,54,55,56 and bidirectional correlations are identified between economic growth and agricultural productivity increase in many studies, suggesting causal44,57,58 and non-causal connections59. Thus, in this study, gross domestic product (GDP) per capita, as a proxy of technological and institutional background of agricultural production was employed.
In an attempt to fill in the gaps mentioned above, long-term trends in the wheat and maize yields and harvested areas of all European countries are charted for 1993–2017, and for 1961–1991, in the case of territorially continuous European countries. Following this, the associations will be mapped between (1) precipitation and temperature, and GDP change, as explanatory factors, and (2) wheat and maize yields, as response variables. Due to the fact that available time series do not differentiate between wheat sown in autumn and spring for Europe, and further considering that an overwhelming majority of European wheat is sown in autumn (> 95%)60, here wheat was examined as winter wheat. A hypothesis of the research is that rising summer temperatures have had an increasingly negative impact on cereal yields in the majority of Europe. Consequently, and conversely, the positive impact of precipitation may be expected to increase significantly in summer months. Finally, an intensive yield convergence driven by economic, including agrotechnological development is also predicted for the post-communist European states, with its beginnings datable to the mid-1990s.
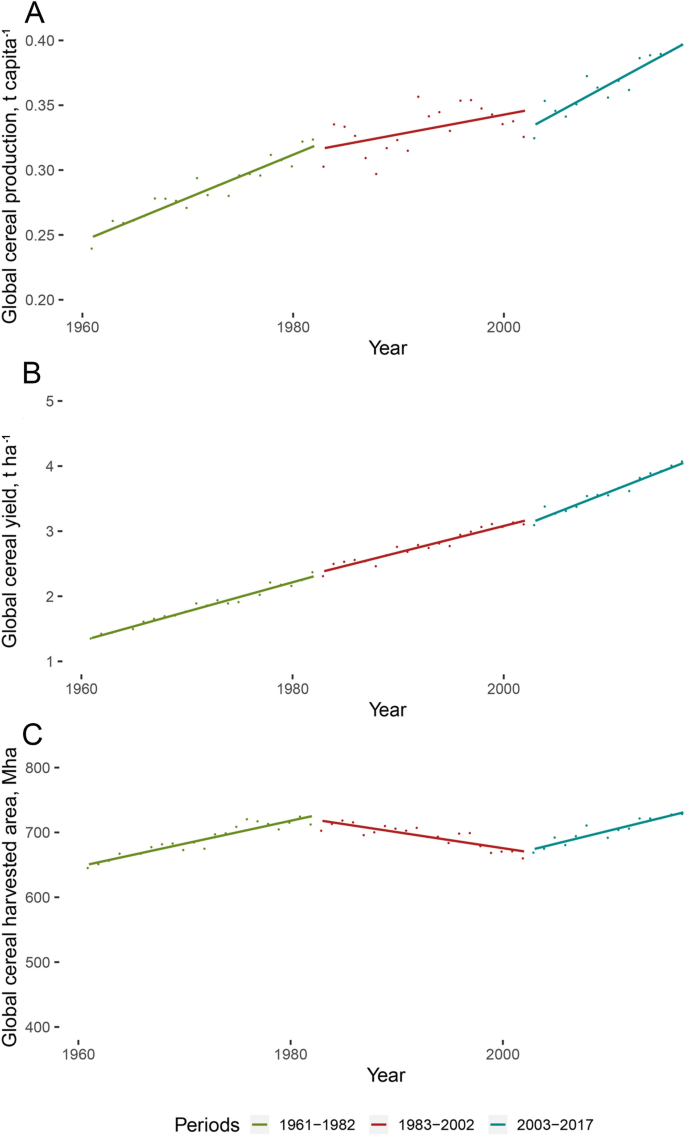
According to World Bank calculations on the basis of data collected by the FAO, between 1993 and 2017 global cereal production increased from an estimated 1.9 to 3.0 billion tons, a jump of 58%, while the global population rose from 5.5 to 7.5 billion, that is, a growth of 36%61. This spectacular growth in production was based primarily on efficiency gains (Δt ha−1 = 48.4%), since the area under cereal cultivation only grew by an estimated 5.0% in this period3. As a result, global average per capita cereal production reached an estimated 0.4 metric tonnes in 2017 (Fig. 1), that is, a level 16% higher than 25 years previously. The average year-to-year rate of increase in global cereal production per capita and global cereal yield (t ha−1) reached 1.4% and 2.6% between 1961 and 1982, respectively; slowing down to an average 0.2% tonnes per capita increase and 1.5% yield increase in the next 20 year period (1983–2002), then rising back to a 1.6% tonnes per capita increase in production, and 1.8% yield growth between 2003 and 201761. While global cereal production almost quadrupled between 1961 and 2017, the cereal area harvested expanded by an estimated 12.9% in this 57 year period3,61.
Figure 1
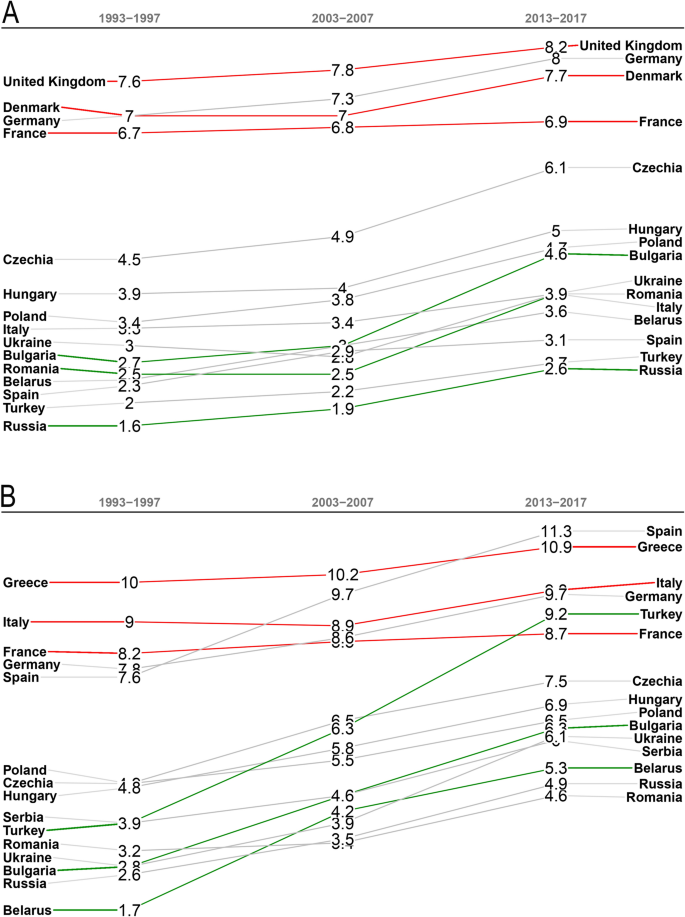
The European average of wheat and maize yields increased by an estimated 32%, and yields, with a few exceptions, increased significantly in the majority of European countries over the period of 1993–2017. In the case of wheat, however, this development was not continuous, since in accordance with global trends, the majority of the continent saw a yield stagnation or decline between the late 1980s and the mid-2000s (Fig. 2A, Supplementary Fig.S1). Although yield increase started in several countries and regions from the 2000s, wheat yield stagnation is observable over the entire period 1993–2017 in Austria, France, Moldova, the Netherlands, Norway, Portugal, Slovakia, Switzerland and the United Kingdom. Meanwhile, maize yield stagnated in Belgium, Bosnia–Herzegovina, France, Italy, Moldova and Slovakia between 1993 and 2017 (Fig. 3C, Supplementary Table S2, Fig.S2). Western Europe is one of the most efficient cereal producing regions on earth, where wheat and maize yields grew by 52% and 60%, respectively, comparing the periods of 1961–1991 and 1993–2017 (Table 1). No data could be found for cereal production of Eastern European countries (Belarus, Moldova, Russia and Ukraine) before 1992, making it difficult to track long-term development there. What is certain, however, is that a noticeable transformation took place from 1993–1997 to 2013–2017: wheat production leapt up, from 55 million tonnes per year (Mt y−1) to 95 Mt y−1, implying that what are now the four Eastern European countries (Table 1) are currently responsible for almost an eighth of global wheat production3. In this 72% increase one factor stands out, namely, yield improvement (Fig. 3A,C). Even more impressive indices may be found in the case of maize, since in Eastern Europe maize production increased sevenfold, from 6 to 42 Mt y−1 between 1993–1997 and 2013–2017 (Fig. 3C). As a result, two formerly negligible maize producers, Ukraine and Russia, have found a place among the ten world-leaders in maize production. The Ukrainian maize harvest (27 Mt y−1) was almost double that of France (14.7 Mt y−1), formerly the leading maize producer in Europe in 2013–2017, (Supplementary Table S6).
Rank table changes of (A) wheat and (B) maize yields (t ha−1) in the 15 biggest European producers between the periods 1993–1997 and 2013–2017. Green lines indicate the three countries with the highest yield growth and red lines the three countries with the lowest yield growth. Supplementary Figs. S1 and S2 show the total European yield rankings. Data sources: FAOSTAT3.