Posted on September, 27, 2024 at 10:17 am
Earlier today, the final balance sheets for the 2023/24 season were published. The final balance sheets take into account full season official statistics. However, it is important to note that this year an adjusted figure has been used for the wheat and barley end of season stocks.
After reviewing last season’s data, and collecting anecdotal evidence from industry, it is clear that the unusually high level of imports last season were not fully accounted for across the stocks surveys. As well as some gaps in the merchants, ports and co-ops (MPC) data, an abnormally high volume of wheat was also held in futures stores as at the end of June. Both of these gaps have now been accounted for in the adjusted figure. In order to avoid any future misreporting in the MPC figures specifically, a review of this survey will be carried out, and actions implemented before the release of the February 2025 stocks data.
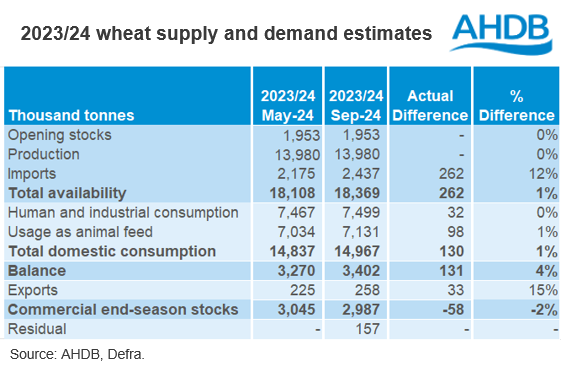
The end of season stocks for wheat and barley now sit at 2.987 Mt and 1.218 Mt respectively. For wheat, this closing stocks figure is the highest since at least 1999/2000, and just below the 3.045 Mt estimated in May.

This heavy wheat ending stocks figure will partially offset the forecast decline in wheat production this season (2024/25). However, if domestic consumption is to stay relatively in line with recent trends, the UK will still rely on firm wheat imports this season to cover the lack of domestic supply.
After the full season statistics were taken into account, residuals were identified for wheat, barley and maize, while a deficit for oats has been identified. While in theory, a balance sheet should ‘balance’ when all aspects of supply and demand are considered at the end of the season, as much of the data is collected through surveys, we can expect to be left with a residual or deficit on home grown grain.
Of course, while there will always be a margin of error in any survey, due to comprehensive coverage in the market, we can be fairly confident in the reliability of the trade data and cereal usage surveys. Despite the fed on farm figure perhaps being less reliable, we know that the figure is unlikely to see great fluctuations year on year, and it has been estimated based on market conditions last season. As such, as in previous years, we are left with the Defra production (2023) and on farm stocks figures.
For wheat, a residual of 157 Kt has been identified. While there is no available confidence interval for UK production, the confidence interval on England production (91% of UK crop) for 2023 is +/- 245.9 Kt. For on farm stocks in England and Wales as at the end of June 24, the confidence interval is +/- 206 Kt. As such, the wheat residual is more than accounted for within these intervals.
Similarly, for barley, a residual of 112 Kt has been identified. The England 2023 production figure (69% of UK crop) has a confidence interval of +/- 192.2 Kt. On farm barley stocks as at the end of June 24 in England and Wales had a confidence interval of +/- 80 Kt. Again, indicating that this barley can be accounted for within these figures.
Finally, for oats, a deficit of 35 Kt was identified. The confidence interval on England production (77% of the UK crop) in 2023 was +/- 53.3 Kt. For on farm stocks in England and Wales as at the end of June 24, that interval was +/- 30 Kt on the 16 Kt estimated.
As such, while there is some margin of error in survey results for usage, as well as some uncertainty in the fed on farm figure, we are confident that the majority of this season’s residuals/deficit sits within these production and stocks figures.
Source: AHDB